
Using O.B. rates to dictate when players should “go for it”
August 14, 2019 by Aaron Howard in Analysis with comments
Last year around this time I wrote an article about the Ledgestone Open and how players who finished well played somewhat aggressively. I reached this conclusion because players who finished close to the top of the leaderboard did not have the lowest OB rates in the field, which indicates they went for some potentially risky shots, executed those shots, and scored well.
A key phrase in the previous sentence is, “they went for some potentially risky shots.” Players who finished well did not have the highest OB rates either. They went for some shots and not others, which corresponds to the intermediate OB rates I found for those high-finishing competitors in my previous analysis.
Think of it like a Goldilocks-type scenario. Too much or too little OB is bad. An intermediate amount is just right.
More on that in a bit. But first let’s remember why are we talking about Ledgestone. This year’s MPO field at PDGA Pro Worlds will be playing on past and present Ledgestone courses, Lake Eureka and Northwood, and Lake Eureka (and to a much lesser extent this year, Northwood) infamously has a lot of artificial OB, making it a good test case for investigations like this one.
One relative weakness in my previous analysis was that I looked at how OB rate changed with finishing position, or place, and not score. Score is a more nuanced measure of player performance than place, so this time I ran the same analysis as in my previous article, but I used score instead of place.1
As you can probably guess, the pattern holds up.2 The best scores are associated with intermediate OB rates. Whereas, players who have very low or very high OB rates do not score as well. You can see that relationship with the blue, best fit line that is swooping down, then back up again. Goldilocks! It may not look like the line has much slope, but an increase from 0% to 1% OB rate can save you 0.8 strokes, which isn’t nothing.
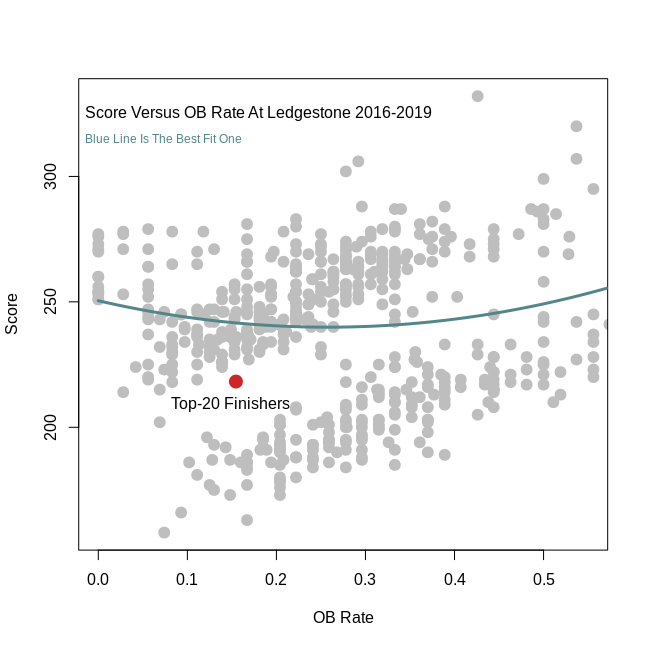
The plot also includes a red dot indicating the average OB rate for players who finished in the top 20, which is about 15.5% and much higher than 0.
But, to make this analysis even more meaningful I think we have to provide context regarding the players who are throwing these shots. Are those who finish in the top 20 just playing their standard games or are they actually playing more aggressively at the Ledgestone (and 2019 Pro Worlds) courses?
To get at that question I compared the event OB rate for players who finished in the top 20 at Ledgestone since 2016 to those same players’ career average OB rates, and I found that those players, on average, have 0.68 standard deviations lower OB rates at Ledgestone than other tournaments in which they competed.3 I am reporting these results in standardized form because Ledgestone has higher OB rates than other tournaments, so comparing the raw numbers would be deceiving.
These results lend further credence to the idea that these players aren’t just going out and throwing wildly. Instead, they are picking their spots and executing well, which is not too surprising given that they finish in the top 20 of a tournament with one of the larger fields on tour.
This brings me to my last thought.
What is the right spot? When should players be going for it (e.g., the green) or laying up?
The answer to that question is a hard one and depends on a lot of things, including the player, the hole, the weather, the situation (e.g., is it a high leverage shot like on hole 18 of the final round?), and myriad other factors. But we can use a player’s average statistics (such as average Circle 1X putting rates, Circle 1 in regulation rates, etc.) to get an idea of average, or long term, outcomes for certain scenarios in a probabilistic framework.
I am going to use a simplified scenario as a case study to demonstrate how one goes about analyzing decisions in this probabilistic framework. I am going to make the results of this case as generalizable as possible, but I cannot possibly cover every decision making scenario here.
Let’s start with a par 3 hole that has OB inside the circle. It is not a common phenomenon, but does happen. Should a player go for the green in this case? It depends on the frequency with which the possible outcomes occur. There are innumerable possible outcomes, so to make this easier let’s just consider the two important ones: the player throws it OB or makes the green. If we assume even further that this is an either/or situation where the player either throws the disc OB or lands on the green (like an island), then we can capture the probabilities of these outcomes using Circle 1 in regulation and putting rates.
The results for Paul McBeth, the player with the best C1iR rate in disc golf this year, going for it plays out as follows. He will score a birdie about 53% of the time, which occurs if he makes the green (58% of the time) and hits the C1X putt (91%).4 He will score a par 43% of the time, which occurs when he misses the green (42%), goes OB, and makes the putt (91% of the time with a C1P after taking his meter relief from OB), or when he makes the green (58%), misses the putt (9%), and makes the comebacker (assumed 100% of the time in this case). He will bogey if he misses the green (48%), goes OB, and misses the putt (9%).
Given these simplified circumstances, if McBeth goes for the green his average score will be around 0.50 strokes under the break even point, which is par. If on average you score under par, go for it. If on average you shoot over par, lay up. So, no brainer for McBeth, he should go for it.
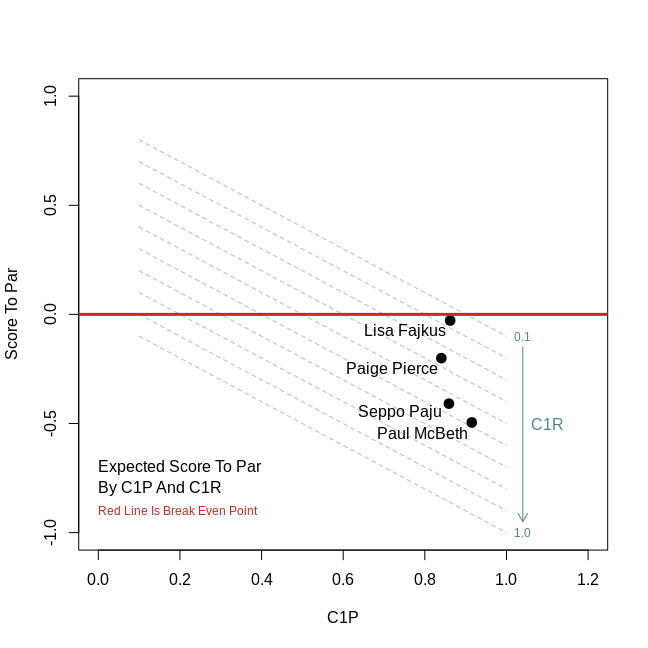
The plot below shows the generic relationship between C1 putting, C1 in regulation, and score relative to par in this scenario. The plot also shows the break-even point (par) with the red line and the outcomes for McBeth, Seppo Paju, Paige Pierce, and Lisa Fajkus. Somewhat surprisingly, the math suggests that they should ALL go for it.
In any circumstance, OB within the circle sounds quite punitive, but within this simplified scenario the math suggests that most of the good players should go for the green. Very interesting. I would even go as far to say that since McBeth’s and Seppo’s scores are so low that they should almost always go for greens with Circle 1 OB, which I think the generally do. Fajkus on the other hand, should probably take more into consideration given her razor thin margin.
This example scenario is a vast simplification of the mental math that players must do on every hole, especially at courses like Lake Eureka and Northwood, and it probably explains why many of them have put in double-digit numbers of practice rounds over the past few weeks. Each player is trying to maximize their strengths and minimize their weaknesses. They are trying to find their own Goldilocks zone of when to go for greens and when to layup.
I look forward to seeing how the mental math that all the competitors are going through plays out on the courses this week in Illinois.

